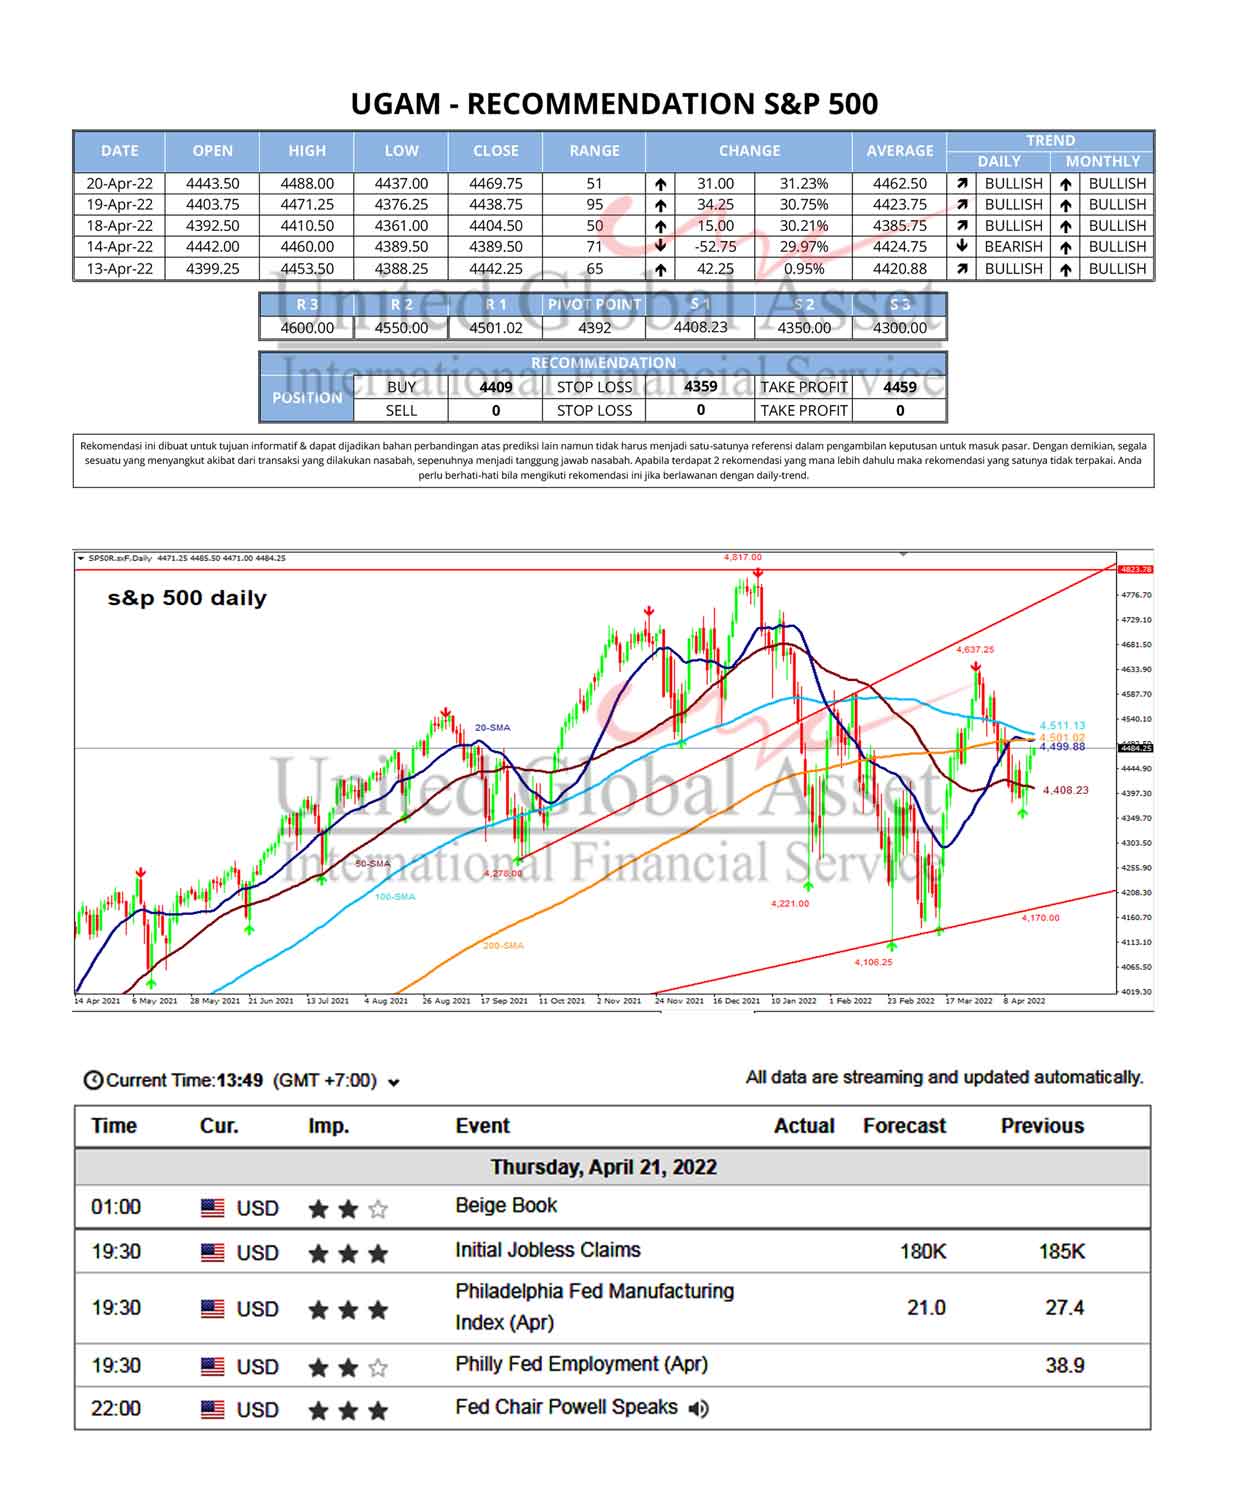
Fundamental News - SP500
S&P 500 Index futures are edging lower at the mid-session on Monday as climbing Treasury yields and prospects of rising inflation triggered valuation concerns, hitting shares of technology-related companies.
Largely upbeat fourth-quarter earnings had powered Wall Street’s main indexes to record highs earlier last week, but the rally lost stream on fears of a potential snag in countrywide inoculation efforts and inflation concerns rising from a raft of stimulus measures.
At 16:51 GMT, March E-mini S&P 500 Index are trading 3884.25, down 18.75 or -0.48. This is up from an earlier low at 3861.25.
Yields on 10-year Treasury notes have already reached 1.38%, above the psychological 1.30% level.
Daily Swing Chart Technical Analysis
The main trend is up according to the daily swing chart, however, momentum has been trending lower since the formation of the closing price reversal top on February 16.
A trade through 3959.25 will negate the closing price reversal top and signal a resumption of the uptrend. The main trend will change to down on a trade through 3656.50. This is highly unlikely but there is room to the downside for a notable correction.
The minor trend is down. This confirms the shift in momentum. A trade through 3936.00 will change the minor trend to up. This will shift momentum to the upside.
The minor range is 3959.25 to 3861.25. Its 50% level at 3910.25 is new resistance.
The short-term range is 3656.50 to 3959.25. Its 50% level at 3807.75 is the next downside target price. This is followed by another 50% level at 3777.50.
Technical analysis
A sustained move under the intraday low at 3861.25 will indicate the selling pressure is getting stronger. This could trigger an acceleration into the first pivot price support at 3807.75.
Holding 3861.25 could fuel a late-session short-covering rally. Overcoming the pivot at 3910.25 will indicate the buying is getting stronger with 3936.00 the near-term target.


